views
Evaluating Stock Ratios

Look up the stock on a stock trading website. Good sites include Morningstar or Yahoo Finance. The stock's profile will include the current market price of the stock, as well as its cash flow, dividends, asset ratios, and other important information for valuing the stock. Most of these websites will calculate the P/E ratio, P/B ratio, debt-to-asset ratio, and current ratio for you. You can also find information like the stock's earnings per share, book value per share, total assets, and total liabilities on these pages.

Look for stocks with a low price/earnings (P/E) ratio. A P/E ratio compares the current price of the stock with the earnings made from each share. A low ratio indicates a cheaper stock. Many stock trading websites will list the P/E ratio. You can also calculate it yourself. To calculate the P/E ratio yourself, first find the earnings per share (EPS) by taking the total profit of that company for last year and dividing it by the number of shares. Next, divide the current stock price by the EPS to get the P/E ratio. For example, if a company made $50 million and has 5 million shares, the EPS is $10. If the current stock price is $50 and the EPS is 10, divide 50 by 10. The P/E ratio is 5. In general, aim for stocks that have a P/E ratio of under 9. Keep in mind that standard P/E ratios can vary by industry. In some industries, the P/E may be higher than in other industries, but the stock may still be undervalued.

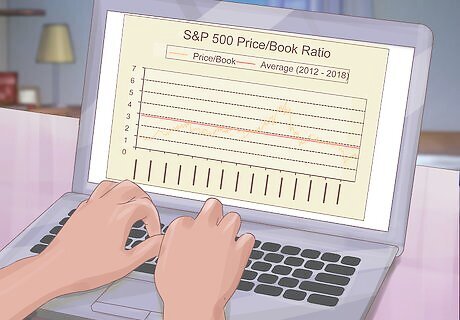
Search for a price/book (P/B) ratio of 1 or less. This ratio compares the current price of stocks with the book value per share of the stock. Look for the book value per share on the company’s balance sheet or on a stock website. Ratios under 1 are undervalued. To get the P/B ratio, take the current price of the share and divide by the book value per share. For example, if a share currently costs $60 and the book value per share is $10, the P/B ratio is 6. The book value of a stock is the price of the stock in the company's balance books. It is based on the company's assets and liabilities. This information is usually publicly listed on the stock's page.

Choose companies with a debt-to-asset ratio of 1.10 or less. This means that they have more assets than they have debt. This is a sign of a strong company and a good stock. Stock websites usually will state the debt-to-asset ratio on the stock’s page. You can also calculate it yourself. To calculate the debt-to-asset ratio yourself, divide the total debt of the company by the total assets. For example, if the total debt is $50,000 and the total assets are $100,000, the company’s debt to asset ratio is 0.5.

Pick stocks with current ratios higher than 1.5. The current ratio compares the assets of a company to its liabilities. A 1.5 shows that the company has more assets than they do liabilities. Most stock websites will list the current ratio on the stock’s balance sheet. To calculate it yourself, divide the company’s assets by the company’s liabilities. For example, if the company has assets of $75,000 and liabilities of $50,000, the current ratio is 1.5. An asset is anything that the company owns that produces value. Liabilities are anything that the company owns that could lose value, including its debt.
Picking a Stable and Profitable Stock

Pick a stock with a Standard and Poor's (S&P) Quality Rating of at least B+. Standard and Poor's is a major financial company that runs several important stock indexes. Their ratings are considered a gold standard in the industry. Their quality scale runs from D (for low-quality stocks) all the way up to A+ (for quality stocks). A B+ rating indicates that the stock is stable and likely to grow. You can check the quality rating on the S&P website.

Evaluate the cash flow of the company. A company with a positive cash flow and a low price is usually undervalued. Check the cash flow of the company on the “Cash Flow” section of their stock profile online. Compare the current cash flow to previous quarters or years. Look for cash flow that has stayed steady or increased. Avoid stocks with negative or decreasing cash flow. Cash flow tells you how much money the company actually holds. A positive cash flow may indicate that the stock is more liquid, which means that it is easier to sell when you are ready.

Check to see if the company is paying dividends. Dividends are small yearly payments paid to shareholders from the company. Dividends allow you to make a small profit while you wait for your undervalued stocks to become overvalued stocks. Look for stocks that pay steady or increasing dividends each year. To see if a stock pays dividends, look on their stock profile for dividend yields. If the company has a dividend yield posted, then it means that they pay out dividends.
Finding Undervalued Stocks

Study one sector of the market to learn which stocks are undervalued. Different industries have different markers of success. If you focus on 1 or 2 industries, you can begin to learn what is expected in that sector of the market. You may be able to recognize undervalued stocks more easily. For example, in the technology sector, software companies may have an average P/E in the 70s while hardware companies may have an average P/E between 15-20.

Buy stocks during market crashes and corrections. When the market drops, many investors may sell their stocks to cut their losses. Many otherwise profitable companies may have undervalued stocks during this time.

Check a stock's value after a disappointing quarter. If you hear a company missed expectations for this quarter, their stocks may drop. This may cause their stock to be undervalued for a certain period of time. If the company has a stable history and if they maintain a good S&P rating, this stock is still a good buy. Read financial websites and watch financial news to follow trends for certain companies. If a company missed its expectations, it may be reported on the news.

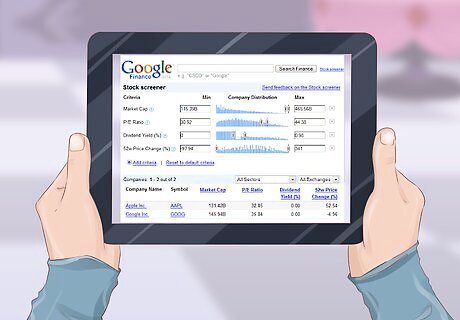
Use an online stock screener to locate undervalued stock. Online tools like Google Stock Screener or Yahoo Stock Screener let you set certain criteria for your stock. You can set an ideal P/E ratio, P/B ratio, current ratio, and other factors. The tool will only show stock that fit that criteria. For example, you can set the screener to search for stocks that have a P/E ratio of less than 20 or you can ask for stocks with a P/B ratio of less than 5.


Comments
0 comment