views
New Delhi: In an unusual move, the Reserve Bank of India on Wednesday reduced the benchmark lending rate by 35 basis points to 5.40 per cent amid concerns over slowdown in economy. The 35 basis points (bps) cut in repo is unusual, as the RBI has been changing the interest rate by 25 or 50 bps in the past.
The RBI also lowered the GDP growth target for 2019-20 to 6.9%, as against the earlier estimate of 7%.
The fourth consecutive rate cut is expected to lower equated monthly installments (EMIs) for home and auto buyers, and borrowing cost for corporate. Earlier this week, banks had assured Finance Minister Nirmala Sitharaman of passing on the benefits of RBI's rate cut to borrowers.
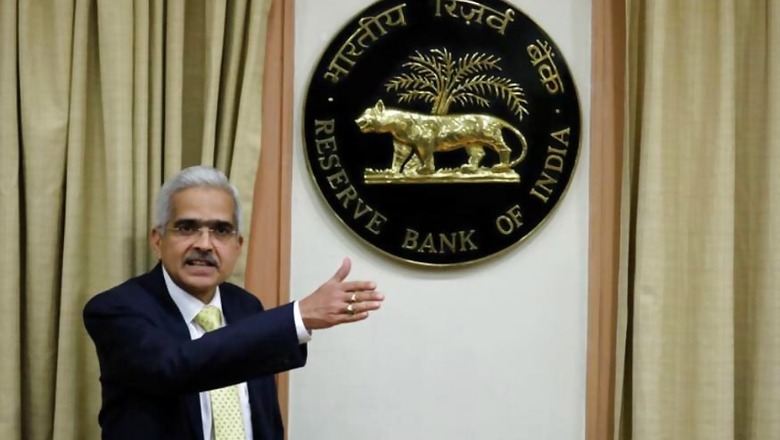
When asked why the RBI opted for a 35-basis point rate cut, RBI Governor Shaktikanta Das said it is not unprecedented, and added that a 25-basis point reduction was inadequate while 50 bps was excessive, so the MPC took a balanced call.
Noting that inflation is currently projected to remain within the target over the next 12 months, the MPC said since the previous policy in June, domestic economic activity continues to be weak, with the global slowdown and escalating trade tensions posing downside risks.
The key takeaways of the RBI’s decision to lower the repo rate:
- Repo rate cut by 35 basis points to 5.40 percent
- Reverse repo rate adjusts to 5.15 percent
- Marginal standing facility (MSF) and bank rate has been adjusted to 5.65 percent. MSF is a new scheme announced by the Reserve Bank of India in its Monetary Policy (2011-12) and refers to the penal rate at which banks can borrow money from the central bank over and above what is available to them through the LAF window.
- During the meeting, four MPC members voted for 35 bps cut and two voted for a 25 bps cut.
- The RBI raised banks’ exposure to each NBFC to 20 percent of bank Tier-I capital from 15 percent. The RBI has also reduced the risk weight for consumer credit to 100 percent from 125 percent.
- GDP growth target for 2019-20 lowered to 6.9% against the earlier estimate of 7%.
- April-June 2020 consumer inflation (CPI) projected at 3.6 percent, while the July-September CPI inflation projected at 3.1 percent. The October-March CPI inflation projected at 3.5-3.7 percent.
Here's the full text:
On the basis of an assessment of the current and evolving macroeconomic situation, the Monetary Policy Committee (MPC) at its meeting today decided to:
— reduce the policy repo rate under the liquidity adjustment facility (LAF) by 35 basis points (bps) from 5.75 percent to 5.40 percent with immediate effect.
Consequently, the reverse repo rate under the LAF stands revised to 5.15 percent, and the marginal standing facility (MSF) rate and the Bank Rate to 5.65 percent.
— The MPC also decided to maintain the accommodative stance of monetary policy.
These decisions are in consonance with the objective of achieving the medium-term target for consumer price index (CPI) inflation of 4 percent within a band of +/- 2 percent, while supporting growth.
The main considerations underlying the decision are set out in the statement below.
Assessment
Global Economy
— Global economic activity has slowed down since the meeting of the MPC in June 2019, amidst elevated trade tensions and geo-political uncertainty. Among advanced economies (AEs), GDP growth in the US decelerated in Q2:2019 on weak business fixed investment. In the Euro area too, GDP growth moderated in Q2 on worsening external conditions. Economic activity in the UK was subdued in Q2 with waning consumer confidence on account of Brexit related uncertainty and weak industrial production. In Japan, available data on industrial production and consumer confidence suggest that growth is likely to be muted in Q2.
— Economic activity remained weak in major emerging market economies (EMEs), pulled down mainly by slowing external demand. The Chinese economy decelerated to a multi-year low in Q2, while in Russia subdued economic activity in Q1 continued into Q2 on slowing exports and retail sales. In Brazil, the economy is struggling to gain momentum after contracting in Q1 on weak service sector activity and declining industrial production. Economic activity in South Africa appears to be losing pace in Q2 as the manufacturing purchasing managers’ index (PMI) contracted for the sixth month in succession in June and business confidence remained weak.
— Crude oil prices fell sharply in mid-May on excess supplies from an increase in non-OPEC production, combined with a further weakening of demand. Consequently, extension of OPEC production cuts in early July did not have much impact on prices. Gold prices have risen sharply since the last week of May, propelled by increased safe haven demand amidst rising downside risks to growth and a worsening geo-political situation. Inflation remained benign in major advanced and emerging market economies.
— Financial markets were driven by the monetary policy stances of major central banks and intensifying geo-political tensions. In the US, the equity market recovered most of the losses suffered in May, boosted by dovish guidance by the US Fed and some transient respite in trade tensions with China. EM stocks lagged behind their developed market counterparts, mainly reflecting the weak performance of Chinese and South Korean stocks. Bond yields in the US, which were already trading with a softening bias on increased probability of policy rate cuts, fell markedly in early August on escalation of trade tensions. Bond yields in some more member countries in the Euro area moved into negative territory as expectations of more accommodative monetary policy by the European Central Bank gained traction. In EMEs, bond yields edged lower on more accommodative guidance by systemic central banks. In currency markets, the US dollar weakened against major currencies in June on dovish guidance by the US Fed but appreciated in July. EME currencies, which traded with an appreciating bias in July, depreciated in early August on escalation of trade tensions.
Domestic Economy
— On the domestic front, the south-west monsoon gained intensity and spread with the cumulative rainfall 6 percent below the long-period average (LPA) up to August 6, 2019. In terms of its spatial distribution, 25 of the 36 sub-divisions received normal or excess rainfall as against 28 sub-divisions last year. The total area sown under kharif crops was 6.6 percent lower as on August 2 than a year ago. The live storage in major reservoirs on August 1 was at 33 percent of the full reservoir level as compared with 45 percent a year ago. Rainfall during the second half of the season (AugustSeptember) has been forecast to be normal by the India Meteorological Department (IMD).
— Industrial growth, measured by the index of industrial production (IIP), moderated in May 2019, pulled down by manufacturing and mining even as electricity generation picked up on strong demand. In terms of the use-based classification, the production of capital goods and consumer durables decelerated. However, consumer non-durables accelerated for the third consecutive month in May. The growth in the index of eight core industries decelerated in June, dragged down by a contraction in petroleum refinery products, crude oil, natural gas and cement. Capacity utilisation (CU) in the manufacturing sector, measured by the order books, inventory and capacity utilisation survey (OBICUS) of the Reserve Bank rose marginally to 76.1 percent in Q4:2018-19 from 75.9 percent in Q3; seasonally adjusted CU, however, fell to 74.5 percent in Q4 from 75.6 percent in Q3. The Reserve Bank’s business assessment index (BAI) for Q1:2019-20 improved marginally, supported by a modest recovery in profit margins of the surveyed firms even as production and order books slowed. The manufacturing PMI rose to 52.5 in July from 52.1 in June, underpinned by a pickup in production, higher new orders and optimism on demand conditions in the year ahead.
— High frequency indicators of services sector activity for May-June present a mixed picture. Tractor and motorcycle sales – indicators of rural demand – continued to contract. Amongst indicators of urban demand, passenger vehicle sales contracted for the eighth consecutive month in June; however, domestic air passenger traffic growth turned positive in June after three consecutive months of contraction. Commercial vehicle sales slowed down even after adjusting for base effects. Construction activity indicators slackened, with contraction in cement production and slower growth in finished steel consumption in June. Import of capital goods – a key indicator of investment activity – contracted in June. The services PMI expanded to 53.8 in July from 49.6 in June on increase in new business activity, new export orders and employment.
— Retail inflation, measured by y-o-y change in the CPI, edged up to 3.2 percent in June from 3.0 percent in April-May, driven by food inflation, even as fuel inflation and CPI inflation excluding food and fuel moderated.
— Inflation in the food group rose to 2.4 percent in June from 2.0 percent in May and 1.4 percent in April, caused by a sharp pick up in prices of meat and fish, pulses and vegetables. Inflation also edged up in cereals, milk, spices and prepared meals. However, inflation in eggs and nonalcoholic beverages softened. Prices of fruits, and sugar and confectionery remained in deflation in June.
— Inflation in the fuel and light group moderated in June, with electricity moving into deflation. Fuels such as firewood and chips, and dung cake have been in deflation from April. Inflation in liquified petroleum gas (LPG) and subsidised kerosene prices, however, remained elevated.
— CPI inflation excluding food and fuel fell by 50 basis points to 4.1 percent in May from 4.6 percent in April, and remained unchanged in June. The softness in inflation in this category was broad-based across clothing and footwear; household goods and services; transport and communication; and recreation and amusement. Housing inflation remained unchanged over the last three months. Despite some moderation, inflation in the health sub-group remained elevated. Inflation in personal care and effects edged up in June due to a resurgence in gold prices.
— Inflation expectations of households remained unchanged in the July 2019 round of the Reserve Bank’s survey for the three months ahead horizon as compared with the previous round, but they moderated by 20 basis points for the one year ahead horizon. Input cost pressures from prices of agricultural and industrial raw materials continued to ease in May and June. Nominal growth in rural wages was muted, while growth in staff costs in the manufacturing sector eased in Q1. Manufacturing firms participating in the Reserve Bank’s industrial outlook survey expect input cost pressures to
soften on account of lower raw material costs in Q2.
— Liquidity in the system was in large surplus in June-July 2019 due to (i) return of currency to the banking system; (ii) drawdown of excess cash reserve ratio (CRR) balances by banks; (iii) open market operation (OMO) purchase auctions; and (iv) the Reserve Bank’s foreign exchange market operations. The Reserve Bank absorbed liquidity of ` 51,710 crore in June, ` 1,30,931 crore in July and ` 2,04,921 crore in August (up to August 6, 2019) on a daily net average basis under the LAF. Two OMO purchase auctions amounting to ` 27,500 crore were conducted in June, thereby injecting
durable liquidity into the system. The weighted average call money rate (WACR) – the operating target of monetary policy – was aligned with the policy repo rate in June, but it traded below the policy repo rate on a daily average basis by 14 bps in July and 17 bps in August (up to August 6, 2019).
— The transmission of policy repo rate cuts to the weighted average lending rates (WALRs) on fresh rupee loans of banks has improved marginally since the last meeting of the MPC. Overall, banks reduced their WALR on fresh rupee loans by 29 bps during the current easing phase so far (February-June 2019).
— Merchandise exports contracted in June 2019, weighed down by the subdued performance of gems and jewellery, petroleum products, rice, engineering goods and cotton. After a modest increase in May, imports also contracted in June, impacted by falling prices of petroleum products and reduced imports of pearls and precious stones, transport equipment, machinery, metalliferous ores, chemicals and fertilisers. As the fall in imports was larger than that of exports, the trade deficit declined modestly during May-June on a y-o-y basis. Provisional data suggest a sequential decline in net services exports in May 2019. On the financing side, net foreign direct investment flows moderated to $ 6.8 billion in April-May 2019 from $ 7.9 billion a year ago. Net foreign portfolio investment (FPI) flows in the domestic capital market amounted to $ 2.3 billion during the current financial year so far (up to August 5, 2019) as against net outflows of $ 8.5 billion in the same period last year. India’s foreign exchange reserves were at $ 429.0 billion on August 2, 2019 – an increase of $ 16.1 billion over end-March 2019.
Outlook
— In the second bi-monthly monetary policy resolution of June 2019, CPI inflation was projected at 3.0-3.1 percent for H1:2019-20 and 3.4-3.7 percent for H2:2019-20, with risks broadly balanced. The actual headline inflation outcome for Q1:2019-20 at 3.1 percent was in alignment with these projections.
— The baseline inflation trajectory for the next four quarters will be shaped by several factors. First, the uptick in food inflation may be sustained by price pressures in vegetables and pulses as more recent data suggest. Uneven spatial and temporal distribution of monsoon could exert some upward pressure on food items, though this risk is likely to be mitigated by the recent catch up in rainfall. Second, despite excess supply conditions, crude oil prices may likely remain volatile due to geo-political tensions in the Middle-East. Third, the outlook for CPI inflation excluding food and fuel remains soft. Manufacturing firms participating in the industrial outlook survey expect output prices to ease in Q2. Fourth, one year ahead inflation expectations of households polled by the Reserve Bank have moderated. Taking into consideration these factors and the impact of recent policy rate cuts, the path of CPI inflation is projected at 3.1 percent for Q2:2019-20 and 3.5-3.7 percent for H2:2019-20, with risks evenly balanced. CPI inflation for Q1:2020-21 is projected at 3.6 percent (Chart 1).
— In the MPC’s June resolution, real GDP growth for 2019-20 was projected at 7.0 percent – in the range of 6.4-6.7 percent for H1:2019-20 and 7.2-7.5 percent for H2 – with risks evenly balanced. Various high frequency indicators suggest weakening of both domestic and external demand conditions. The Business Expectations Index of the Reserve Bank’s industrial outlook survey shows muted expansion in demand conditions in Q2, although a decline in input costs augurs well for growth. The impact of monetary policy easing since February 2019 is also expected to support economic activity, going forward. Moreover, base effects will turn favourable in H2:2019-20. Taking into consideration the above factors, real GDP growth for 2019-20 is revised downwards from 7.0 percent in the June policy to 6.9 percent – in the range of 5.8-6.6 percent for H1:2019-20 and 7.3-7.5 percent for H2 – with risks somewhat tilted to the downside; GDP growth for Q1:2020-21 is projected at 7.4 percent (Chart 2).









Comments
0 comment