
From floods and tornadoes in the United States to a considerably warm winter season in India, the weather around the world is witnessing extreme conditions. El Nino, which is a disruption of the ocean-atmosphere system in the Tropical Pacific, has had severe consequences for weather and climate around the globe and has created a chaos in 2015.
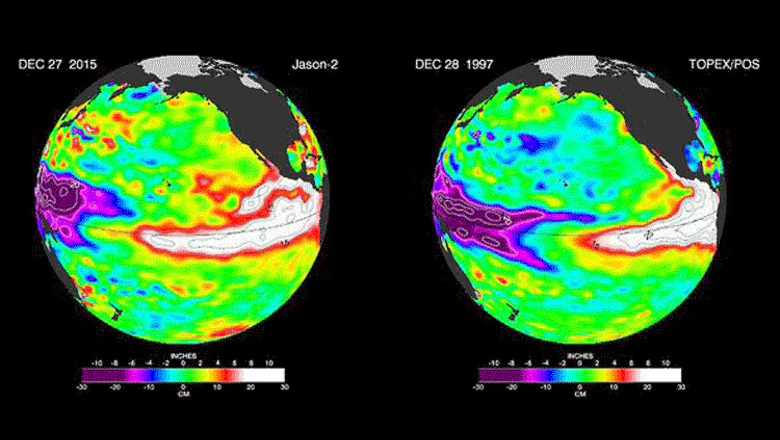
An image from NASA's Jason-2 satellite bears a striking resemblance to one from December 1997, by Jason-2's predecessor, the NASA/Centre National d'Etudes Spatiales (CNES) Topex/Poseidon mission, during the last large El Niño event. Both reflect the classic pattern of a fully developed El Niño.
The images show nearly identical, unusually high sea surface heights along the equator in the central and eastern Pacific: the signature of a big and powerful El Niño. Higher-than-normal sea surface heights are an indication that a thick layer of warm water is present.
El Niños are triggered when the steady, westward-blowing trade winds in the Pacific weaken or even reverse direction, triggering a dramatic warming of the upper ocean in the central and eastern tropical Pacific. Clouds and storms follow the warm water, pumping heat and moisture high into the overlying atmosphere. These changes alter jet stream paths and affect storm tracks all over the world.
El Niño has had its impact in India which can be seen by delayed monsoon rains, as well as dropping of Pacific island sea level. There has also been a widespread coral bleaching which is damaging coral reefs.
There have been droughts in South Africa, flooding in South America and a record-breaking hurricane season in the eastern tropical Pacific. Around the world, production of rice, wheat, coffee and other crops has been hit hard by droughts and floods, leading to higher prices.
El Niño 2015 has caused the warm water layer that is normally piled up around Australia and Indonesia to thin dramatically, while in the eastern tropical Pacific, the normally cool surface waters are blanketed with a thick layer of warm water. This massive redistribution of heat causes ocean temperatures to rise from the central Pacific to the Americas. It has sapped Southeast Asia’s rain in the process, reducing rainfall over Indonesia and contributing to the growth of massive wildfires that have blanketed the region in choking smoke.
In the United States, many of El Niño’s biggest impacts are expected in early 2016. Forecasters at the National Oceanic and Atmospheric Administration favor an El Niño-induced shift in weather patterns to begin in the near future, ushering in several months of relatively cool and wet conditions across the southern United States, and relatively warm and dry conditions over the northern United States.
While scientists still do not know precisely how the current El Niño will affect the United States, the last large El Niño in 1997-98 was a wild ride for most of the nation. The “Great Ice Storm” of January 1998 crippled northern New England and southeastern Canada, but overall, the northern tier of the United States experienced long periods of mild weather and meager snowfall. Meanwhile, across the southern United States, a steady convoy of storms slammed most of California, moved east into the Southwest, drenched Texas, and pumped up by the warm waters of the Gulf of Mexico, wreaked havoc along the Gulf Coast, particularly in Florida.
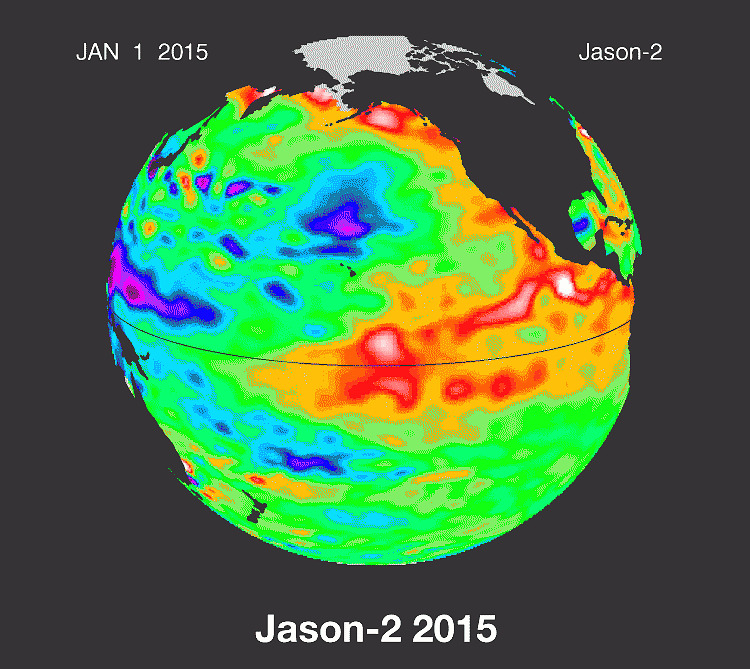
The new Jason-2 image shows that the amount of extra-warm surface water from the current El Niño (depicted in red and white shades) has continuously increased, especially in the eastern Pacific within 10 degrees latitude north and south of the equator. In the western Pacific, the area of low sea level (blue and purple) has decreased somewhat from late October. The white and red areas indicate unusual patterns of heat storage. In the white areas, the sea surface is between 6 and 10 inches (15 to 25 centimeters) above normal, while in the red areas, it is about 4 inches (10 centimeters) above normal. The green areas indicate normal conditions. The height of the ocean water relates, in part, to its temperature, and is an indicator of the amount of heat stored in the ocean below.
Within this area, surface temperatures are greater than 86 degrees Fahrenheit (30 degrees Celsius) in the central equatorial Pacific and near 70 degrees Fahrenheit (21 degrees Celsius) off the coast of the Americas. This El Niño signal encompasses a surface area of 6 million square miles (16 million square kilometers), more than twice as big as the continental United States.
(Information from NASA)


Comments
0 comment