
views
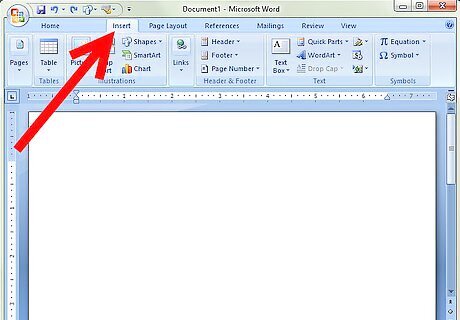
Go to the Insert tab. It is the tab directly to the right of the Home tab.
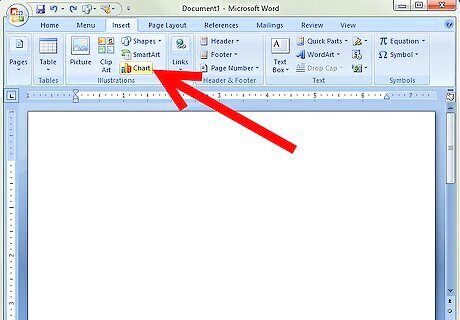
Click on Chart, until Illustrations.
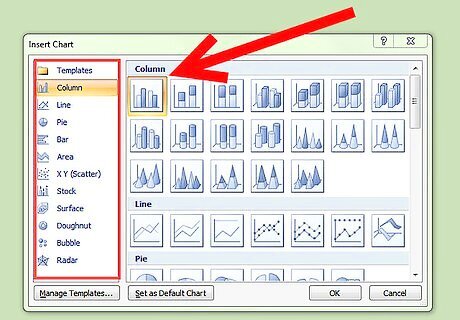
Click on the different categories and scroll down to view types of graphs. They have much more than graphs--including tables, charts, and scatter plots. The categories are: Column, Line, Pie, Bar, Area, X Y (Scatter), Stock, Surface, Doughnut, Bubble, and Radar.
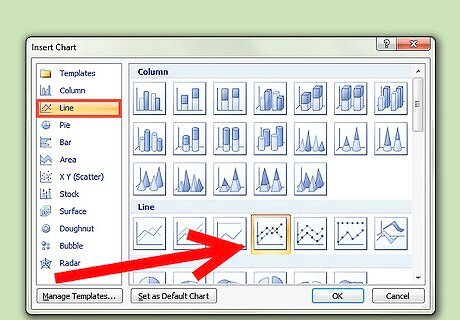
Suppose you choose a Line Graph. Click on the Line tab, and choose how you want your graph to look like. They have different options.
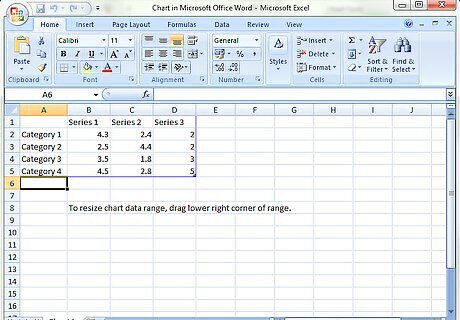
When you choose your graph and how you want it to look, another window will appear. It will be a spreadsheet--Microsoft Excel--all still inside the Word document. You should see Categories 1-4 and Series 1-3. Change them to change your data.
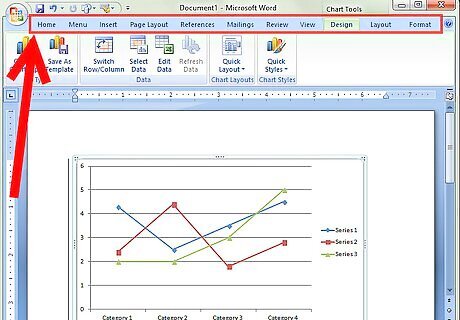
Within this window, there will be several more tabs: Home, Insert, Page Layout, Formulas, Data, Review, and View. You can use the Home tab to change the text--as far as fonts and colors. Play around with some of the other tabs for more options.
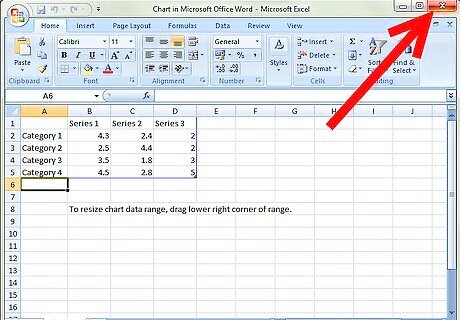
Simply x out of the Excel window and you'll return to Microsoft Word. Your customized graph will appear.





Comments
0 comment