
views
Calculating Variable Costs

Classify your costs as either fixed or variable. Fixed costs are those that will remain constant even when production volume changes. Rent and administrative salaries are examples of fixed costs. Whether you produce 1 unit or 10,000, these costs will be about the same each month. Variable costs vary with production volume. For example, raw materials, packaging and shipping, and workers' wages are all variable costs. The more units you produce, the higher these costs will be. Once you understand the difference between fixed and variable costs, classify each of your business's costs. Many costs, such as the examples mentioned above, will be easy to classify. Others may be more ambiguous. Some costs can be difficult to classify, not behaving in a strict fixed or variable pattern. For example, an employee may be paid a fixed salary in addition to a commission that varies with sales volume. These costs are best broken up into separate fixed and variable elements. In this case, only the employee's commission would be treated as a variable cost.
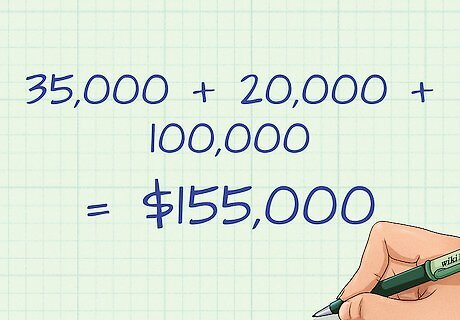
Add together all of the variable costs for a given period. After classifying all your variable costs, total them for a given time period. For instance, consider a simple manufacturing operation that has only 3 variable costs: raw materials, packaging and shipping, and workers' wages. The sum is your total variable cost. Imagine the costs incurred for the most recent year are as follows: $35,000 of raw materials, $20,000 of packaging and shipping, and $100,000 in employee wages. The total variable costs for the year are therefore 35 , 000 + 20 , 000 + 100 , 000 {\displaystyle 35,000+20,000+100,000} 35,000+20,000+100,000, or $ 155 , 000 {\displaystyle \$155,000} \$155,000. These costs are directly related to the production volume for that year.
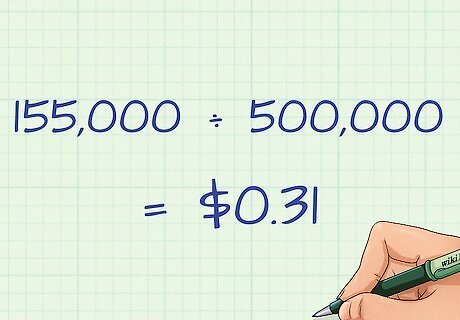
Divide the total variable costs by the production volume. Dividing the total variable costs for a given time period by that period's production volume will yield the unit variable cost. Specifically, unit variable cost can be calculated as v = V Q {\displaystyle v={\frac {V}{Q}}} v={\frac {V}{Q}}, where v is unit variable cost, V is total variable cost, and Q is the quantity produced. For example, if the business above produced 500,000 units of its product that year, its unit variable cost is $ 155 , 000 500 , 000 {\displaystyle {\frac {\$155,000}{500,000}}} {\frac {\$155,000}{500,000}} or $ 0.31 {\displaystyle \$0.31} \$0.31. The unit variable cost is simply the variable cost per unit produced. It is the extra cost incurred by producing each additional unit. For example, if the business above produced 100 more units, it would expect to incur additional production costs of $31.
Using the High-Low Method

Understand mixed costs. Sometimes costs cannot easily be categorized at variable or fixed. These costs may vary with production, but also are necessary even in the absence of production or sales. These costs are referred to as mixed costs. Mixed costs can be split up into fixed and variable components as part of an effort to accurately measure either type of cost. An example of a mixed costs is the wage expense for an employee that earns salary plus commissions. The salary is paid even if no sales are made, but commission depends on the sales volume. In this example, the commission is a variable cost and salary is fixed. Mixed costs can also apply to wage earners if they are guaranteed a fixed number of hours each pay period. Regular hours would be a fixed cost, but any overtime would be variable. In addition, the cost of employee benefits might be recognized as a mixed cost. A somewhat more complicated example is that of utilities costs. Electricity, water, and gas must be paid even if no production occurs. However, they may be used in greater amounts as part of production. Splitting these costs into fixed and variable categories requires a more complex method.

Measure activity and cost. In order to split up mixed costs into fixed and variable components, you can use the "high-low" method. This method starts with the mixed costs from the highest and lowest months of production and uses the difference to calculate variable cost proportion. To get started, determine which months experienced the highest and lowest levels of activity (production). Record the activity in a measurable way (like machine-hours) and the mixed cost you want to assess for each month. For example, imagine that your company cuts metal parts with a water cutter as part of a production process. This requires water as a variable cost that increases with the amount of production. However, you also use have a water expense that arises from running your production facility (for drinking, restrooms, etc.). Your water costs would then be a mixed cost. Say that in this example, in the highest month you had a water bill of $9,000 and 60,000 machine-hours of production. In the lowest, you had an $8,000 water bill and 50,000 machine-hours of production.
Calculate the variable cost rate. Find the difference between both figures (cost and production) by finding the variable cost rate. The variable cost rate can be found using the formula V C R = C − c P − p {\displaystyle VCR={\frac {C-c}{P-p}}} VCR={\frac {C-c}{P-p}}, where C and c are the costs for the higher and lower months, respectively, and P and p refer to their production levels. In this example, this would be V C R = $ 9 , 000 − $ 8 , 000 60 , 000 − 50 , 000 {\displaystyle VCR={\frac {\$9,000-\$8,000}{60,000-50,000}}} VCR={\frac {\$9,000-\$8,000}{60,000-50,000}}. This then simplifies to V C R = $ 1 , 000 10 , 000 {\displaystyle VCR={\frac {\$1,000}{10,000}}} VCR={\frac {\$1,000}{10,000}}, which gives $ 0.10 {\displaystyle \$0.10} \$0.10. This means that each additional machine-hour of production costs $0.10.
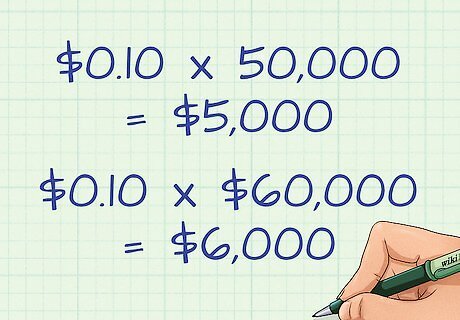
Determine the variable cost. You can now use the variable cost rate to determine what amount of your mixed cost is variable cost. Multiply the variable cost rate by the production amount to get this figure. In the example, this would be $ 0.10 × 50 , 000 {\displaystyle \$0.10\times 50,000} \$0.10\times 50,000, or $ 5 , 000 {\displaystyle \$5,000} \$5,000, for the lower month and $ 0.10 × 60 , 000 {\displaystyle \$0.10\times 60,000} \$0.10\times 60,000, or $ 6 , 000 {\displaystyle \$6,000} \$6,000, for the highest month. These represent the variable costs for each month. You can subtract this from the total monthly cost to get the fixed cost, which is $3,000 in both cases.
Using Variable Cost Information
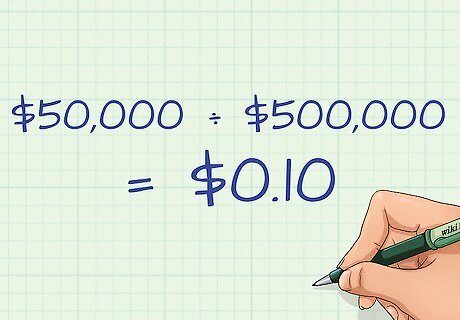
Measure variable cost trends. In most cases, increasing production will make each additional unit more profitable. This is because fixed costs are now being spread thinner across a larger production volume. For example, if a business that produces 500,000 units per years spends $50,000 per year in rent, rent costs are allocated to each unit at $0.10 per unit. If production doubles, rent is now allocated at only $0.05 per unit, leaving more room for profit on each sale. So, as revenues increase, cost of goods sold should also increase, but at a slower rate (as ideally variable cost per unit stay constant and fixed cost per unit declines). To determine whether or not variable costs are staying constant, divide total variable cost by revenue. This will give you an idea of how much of costs are variable costs. You can then compare this figure to historical variable cost data to track variable cost per units increases or decreases. For example, if total variable costs were $70,000 one year and $80,000 the next while revenues were $1,000,000 and $1,150,000, respectively, you could see that variable costs remained fairly stable through those two years at $ 70 , 000 ÷ $ 1 , 000 , 000 {\displaystyle \$70,000\div \$1,000,000} \$70,000\div \$1,000,000, or 7 {\displaystyle 7} 7 percent, and $ 80 , 000 ÷ $ 1 , 150 , 000 {\displaystyle \$80,000\div \$1,150,000} \$80,000\div \$1,150,000, or 6.96 {\displaystyle 6.96} 6.96 percent of revenue, respectively).
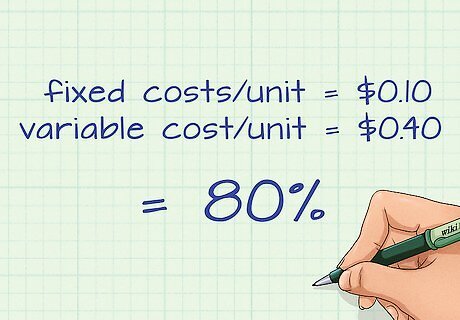
Use variable cost proportion to evaluate risk. By comparing the percentage of variable costs to fixed costs for a unit, you can determine the proportion of each type of expense. This can be calculated by dividing variable costs per unit by total per-unit cost using the formula v v + f {\displaystyle {\frac {v}{v+f}}} {\frac {v}{v+f}} where v and f are the per-unit variable and fixed costs, respectively. For example, if the fixed costs per unit is $0.10 and the variable cost per unit is $0.40 (for a $0.50 total cost per unit), then 80 percent of the unit cost is variable cost ( $ 0.40 / $ 0.50 = 0.8 {\displaystyle \$0.40/\$0.50=0.8} \$0.40/\$0.50=0.8). As an outside investor, you can use this information to predict potential profit risk. If a company primarily experiences variable costs in production, they may have a more stable cost per unit. This will lead to a steadier stream of profit, assuming steady sales. This is true of large retailers like Walmart and Costco. Their fixed costs are relatively low compared to their variable costs, which account for a large proportion of the cost associated with each sale. However, a company with a higher proportion of fixed costs would more easily be able to take advantage of economies of scale (greater production leading to lower per-unit costs). This is because revenues would increase much faster than expenses. For example, a computer software company would have fixed costs associated with product development and support staff, but would be able to scale up software sales without incurring significant variable cost increases. That said, during slumping sales, a company that relied primarily on variable costs would be more easily able to scale back production and remain profitable, while a company with primarily fixed costs would have to find a way to deal with much higher per-unit fixed costs. A company with high fixed costs and low variable cost also has production leverage, which magnifies profits or loss depending upon revenue. Essentially, sales above a certain point are much more profitable, while sales below that point are much more expensive. Ideally, the company should strive to strike a balance between risk and profitability by adjusting their fixed and variable costs.

Compare companies in the same industry. Calculate variable cost per unit and total variable cost for a given company. Then, find data on the average variable cost for that company's industry. This can give you a standard of comparison by which to judge the first company. Higher per-unit variable costs may suggest that a company is less efficient than others, whereas a lower per-unit variable cost might represent a competitive advantage. A higher than average per-unit cost suggests that a company uses a larger amount of or spends more on resources (labor, materials, utilities) to produce goods than their competitors do. This can represent low efficiency or expensive resources. In either case, the company will not be as profitable as its competitors unless it makes some change in its budget. It should reduce its expenses or raise its prices. On the other hand, a company that is able to produce the same goods at a lower cost realizes a competitive advantage by being able to undercut the rest of the market on price. This cost advantage could be due to cheaper resources, cheaper labor, or greater manufacturing efficiency. For example, a company that is able to get cotton at a lower price than their competitors could produce shirts at a lower variable cost and thus charge a lower price for them. Publicly traded companies provide their financial statements publicly either through their websites or the Securities and Exchange Commission (SEC). Variable cost information can be figured out by studying their income statements.

Conduct break-even analysis. Variable costs, if known, can be combined with fixed costs to carry out a break-even analysis on a new project. A manager can scale up the number of units produced and estimate the fixed and variable costs for production at each step. This will allow them to see which level of production, if any, are most profitable. For example, if your company is planning to produce a new product that requires an initial investment of $100,000, you would want to know how many of that product you would need to sell to regain your investment and earn a profit. Doing so would require adding the investment and other fixed costs together with variable costs and subtracting them from revenue at various production levels. You can calculate a break even point using the following formula: Q = F P − v {\displaystyle Q={\frac {F}{P-v}}} Q={\frac {F}{P-v}}. In the formula, F and v are your fixed and per-unit variable costs, respectively, P is the selling price of the product, and Q is the break-even quantity. For example, if other fixed costs over the course of production total $50,000 (in addition to the original $100,000 for a total of $150,000 in fixed costs), variable costs are $1 per unit, and the product sells for $4 per unit, you would calculate a break point by solving Q = $ 150 , 000 $ 4 − $ 1 {\displaystyle Q={\frac {\$150,000}{\$4-\$1}}} Q={\frac {\$150,000}{\$4-\$1}}, which yields a result of 50,000 units.








Comments
0 comment