

Finding Stock Information
Determine the ticker symbol for the stock you want to track. The ticker symbol will be a combination of up to five letters, often abbreviating or suggesting the name of the company or one of its products. This is how the stock is identified on stock charts and tickers. For example, the symbol for Apple is AAPL. For help determining a stock to track, see how to choose stocks.

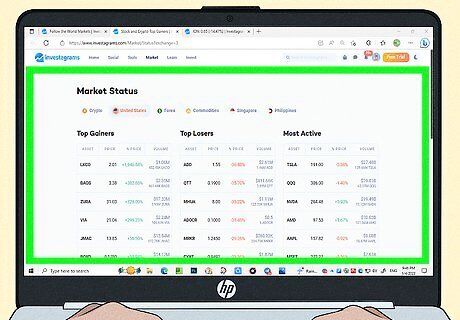
Search for stock information on news websites. Enter the ticker symbol in the search field of a financial services website, or use the stock-tracking tools provided by most major Internet browsers and search engines. For example, Yahoo! and Google both offer market information. You can also find daily stock information in the newspaper. Just look for the ticker symbol under the appropriate exchange heading in the paper’s financial section.

Use your online brokerage account. If you have an online brokerage account, a stock tracking tool is part of your account. Current prices and recent trades will be automatically reflected in your online portfolio. You may also have access to addition tools for analysis and tracking, so check with your online trading platform's help section to find out what you can use. If you have use a premium online brokerage service with a lot of stock tracking features, there may be no reason for you to use any other stock tracking websites. However, if you have a basic, low-fee brokerage service, you may want to use other stock-tracking websites that have more features.
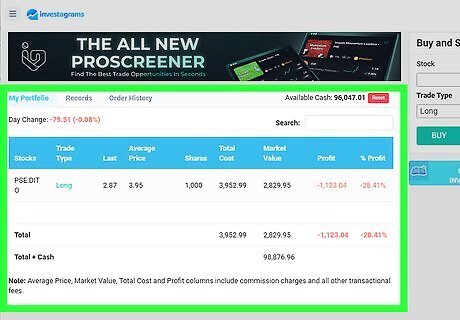
Set up an online portfolio (if you hold more than one stock) to help track your stocks over time. Most financial services sites and search engines offer a free portfolio tool. In most cases, all you need to do to establish an online stock portfolio is log in, click on the portfolio or finance section and enter the ticker symbols of the stocks you are tracking. These portfolios allow you to enter your positions (stocks you own) and then update their price and total value based on changes in the market. Websites like Mint and Wikinvest.com let you track your portfolio for free. They also have iPhone Applications that let you track your portfolio on the go. Real-time stock quotes are usually unavailable through free stock-tracking websites. These sites most often have a pricing delay of 15 minutes. To obtain real-time updates you’ll need to purchase stock or sign up for a fee-based stock-tracking service.

Set up news alerts for the stock. In many cases, your online portfolio or brokerage account may offer price or event alerts for your stocks. These alert you when the price of the stock drops below a certain point or when important information about the company is reported in the news. You can set these services up to send you an email or a text when one these events occurs.
Understanding Stock Information
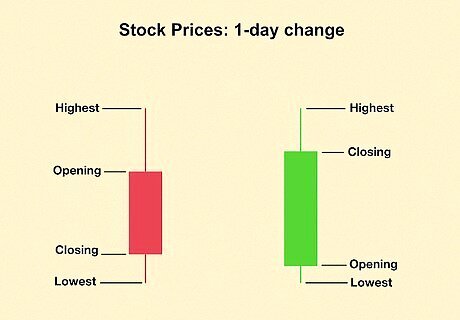
Interpret price changes. The high, low and closing prices indicate how the stock performed in the previous trading day. They are the top, bottom and last price the stock traded at on that day. In contrast, the 52-week high and low columns indicate the volatility of the stock. The greater the difference between those latter two prices, the greater the opportunity for gain or risk of loss with that stock. Conversely, a narrow price range without major swings suggests a more conservative investment. Net change (or simply "change") represents the gain or loss for the stock on a given day. It’s determined by taking the previous day’s closing price and subtracting it from the current or next day’s closing price. For more, see how to read stock quotes.
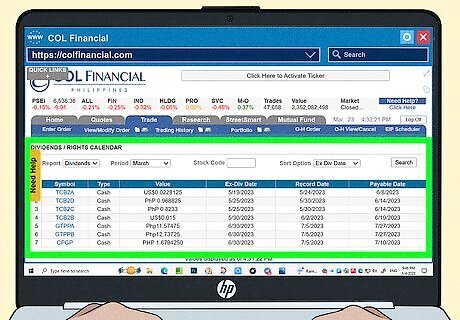
Look at dividends. The dividend column indicates how much the company may pay you to hold a share of its stock for one year. The dividend may be raised, lowered or eliminated depending on company performance. Examine how long the company has been paying dividends and if they have increased the dividend payout over time. Companies that consistently pay dividends, and increase them over time, are considered much more reliable investments than those companies that do not. Dividends are paid when the company’s net earnings (net profits) are paid out to all stockholders evenly. The other option is to reinvest these earnings into the company itself. Companies attempting to grow or change quickly need capital reinvested and tend to not pay dividends (higher risk = higher reward). Companies without as much of a plan for growth or change tend to use their more consistent earnings to pay back shareholders for their (financial) support. This means that growth stocks may not pay dividends but may still be profitable investments due to their growth plans. Another way to understand dividend payouts is to calculate the dividend payout ratio. This allows you to see how much of the company's earnings are paid out to investors and if that number has changed over time.

Understand the PE ratio. Price-to-earnings ratio information is the closing price of the stock divided by the earnings per outstanding share. Basically, it represents investor confidence that the price of the stock will increase in the future. A low P/E ratio may indicate an undervalued company (and a chance for a good investment). Another way to look at the PE ratio is to think of it as an earnings multiple. That is, the ratio represents how much an investor is willing to pay for $1 of current earnings. So, a PE of 18 represents that an investor is willing to pay $18 for $1 of current earnings. A "good" PE ratio is hard to discern directly. That is, a high PE ratio shows you that investors are confident about a company's growth and that the stock value might increase. However, a low PE ratio may represent good potential and might indicate an undervalued stock. The average PE ratio is 20-25. You should compare the company's PE ratio to those of other company in the same industry to get an idea of where this company fits in.
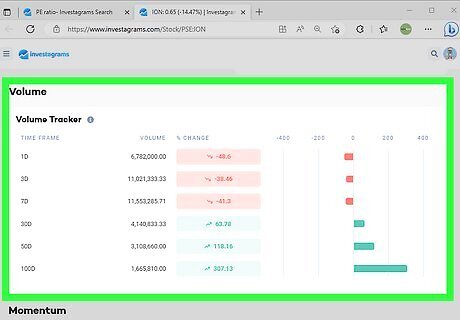
Look at trading volume. Volume is simply the number of shares traded each day. Unusual trading volume in excess of average daily trades may indicate that a stock is either on the rise or anticipating a slump. Generally, if there is a rise in the price accompanying the trading volume, this represents investor confidence. Similarly, increased trade volume accompanied by a reduction in price means that many investors are selling their positions in expectation of a slump.
Watch for buy or sell ratings. Analysts that follow stocks publish price targets, which state their estimated future value for a stock, and also specify ratings. These ratings, usually "buy," "sell," or "hold," indicate what they believe savvy investor should do with a given stock. These ratings, along with an average of all rating for that stocks, can be found on market information websites like Google Finance, Yahoo! Finance, and MarketWatch.
Looking for Patterns
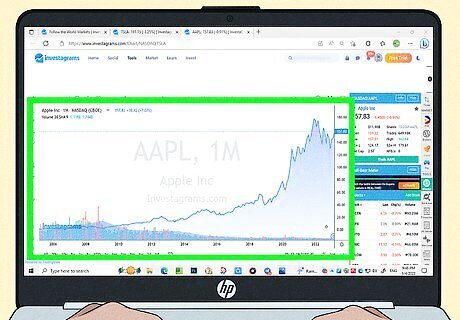
Look at the big picture. Stock prices can be volatile over the course of a day or week. To get a better idea of the stock's performance and growth (or lack thereof), you should look at a longer time period, like a month or year. In addition, try comparing its growth over these period with that of the market. You can use the S&P 500 for these comparisons. Check if it was up when the market was down, or vice versa. This can give you an idea of how the stock will perform over time. You can also find more long term financial information by studying the company's financial statements, which are available from both the SEC and usually on the company's website. For more, see how to research a stock. EXPERT TIP Benjamin Packard Benjamin Packard Financial Advisor Benjamin Packard is a Financial Advisor and Founder of Lula Financial based in Oakland, California. Benjamin does financial planning for people who hate financial planning. He helps his clients plan for retirement, pay down their debt and buy a house. He earned a BA in Legal Studies from the University of California, Santa Cruz in 2005 and a Master of Business Administration (MBA) from the California State University Northridge College of Business in 2010. Benjamin Packard Benjamin Packard Financial Advisor Did You Know? It's actually against the law for financial advisors to promise clients they'll make money in the stock market because it's so unpredictable. With that said, though, over a long period of time (like 100 years, for example), stocks are proven to be a good investment with profitable returns.
Understand the risks of day-trading. Day-trading is different from investing in that day-trading focuses on the short term and is very risky. A day-trader stands to lose significant amounts of money if the bets that they make on the market are wrong or if trading fees eat up all of their gains. In theory, a day-trader could identity patterns that lead to rises or falls in the price of a stock and then profit from these predictions. However, in practice this is very difficult and many day-traders end up losing money and exiting the market. Investors buy securities and hold them for long periods of time with the expectations that they will earn value slowly. Day-traders look for quick jumps and falls in value in the same day or week and trade quickly. Even if trend and pattern analyses are made properly and conservatively, there is still risk that you will lose money on your trades. Be warned that you stand to lose a considerable amount of money if you try to engage in day-trading.
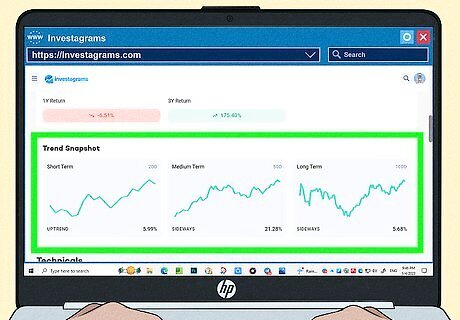
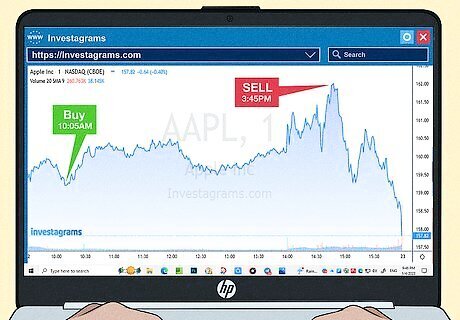
Identify trends. If you do decide to day-trade, the simplest type of pattern you can identify is a price trend. Look for uptrends and downtrends in the price of a stock over daily and weekly periods. However, keep in mind that just because a stock is rising now does not mean it will continue to do so tomorrow, or even in the next few minutes. Another way to identify trends is to study the market itself and the global financial system. Look for relevant news that could move the price of a stock or affect the stability of an industry or economy. Trend identification, along with the rest of the patterns mentioned, is part of what is known as technical analysis, which assesses market trends to help traders make trade decisions.

Look for support and resistance. Support and resistance are terms used by traders to identify prices that a stock usually does not move below or above, respectively. That is, if a stock often gets close to surpassing $40 over a period of time, but never does, the stock has a "resistance" at $40. Identifying these levels for a given stock will help you identify prices that the stock will likely not surpass or fall under.
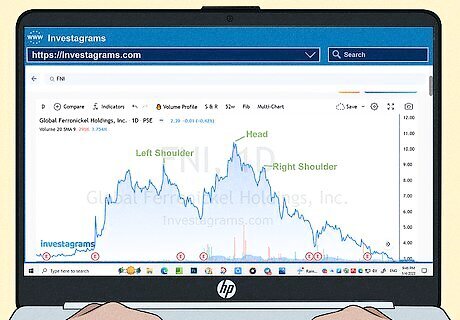
Identify head and shoulders patterns. Traders also use several other more complex patterns to identify shifts in price trends. One the most common of these is the head and shoulders pattern. This pattern is formed when a high is reached (the left shoulder) and then the price drops temporarily only to be replaced with a high even higher than the first one (the head). Then, after another temporary drop, another peak (the right shoulder) is reached that is not as high the head. This pattern identifies the end of an upwards trend in the value of the stock. After this pattern, the price is expected to decline. The lows between the head and two shoulders can also be used to draw a "neckline" that identifies the point at which you should certainly sell the stock.


Comments
0 comment