
views

Determine a null and alternate hypothesis. In general, the null hypothesis will state that the two populations being tested have no statistically significant difference. The alternate hypothesis will state that there is one present.
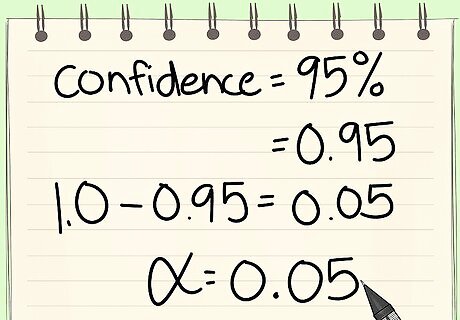
Determine a confidence interval. We will call this the alpha (α) level. The typical value is 0.05. This means that there is 95% confidence that the conclusion of this test will be valid.
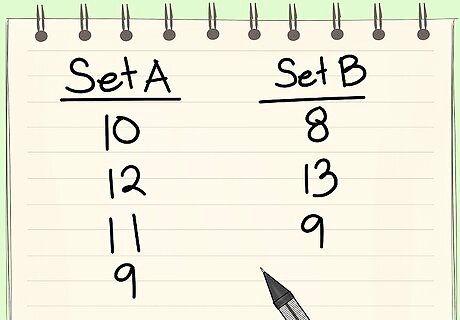
Assign each population to one of two data sets. These values will need to be distinct when using the equation.

Determine the n1 and n2 values. These are equal to the two sample sizes, or the number of data points in each population.

Determine the degrees of freedom. We will call this the k value. On the t-distribution table below, this value is referred to as df. To calculate this value, add both of the n values together and subtract 2.

Determine the means of the two sample sets. We will call these x̄1 and x̄2. This is calculated by adding all of the data points in each sample set together, then dividing by the number of data points in the set (the corresponding n value).
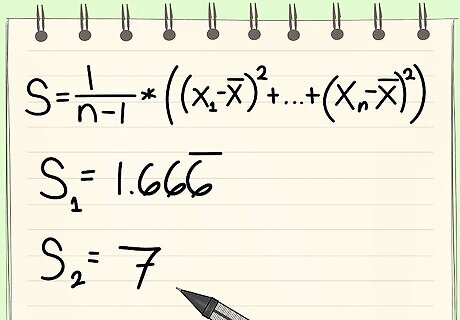
Determine the variances of each data set. We will call these the S-values. This is a number that describes how much the data varies inside its own sample set. Use the following formula.
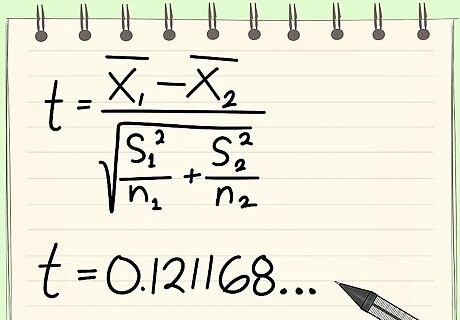
Compute the t-statistic using the following formula.
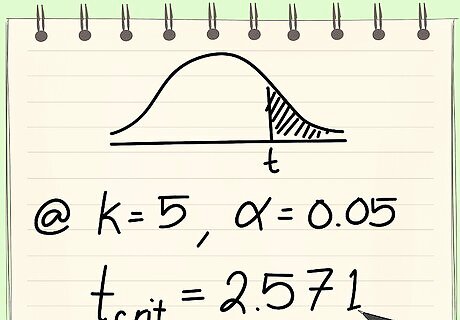
Use the alpha and k values to find the critical t-value on the t-distribution table.
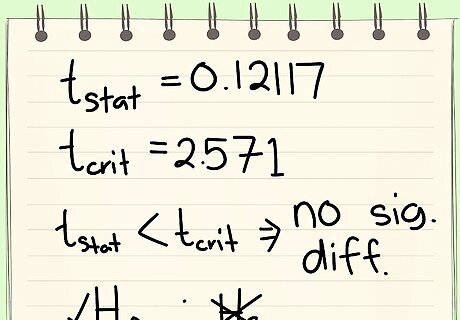
Compare the critical t-value and the calculated t-statistic. If the calculated t-statistic is greater than the critical t-value, the test concludes that there is a statistically significant difference between the two populations. Therefore, you reject the null hypothesis that there is no statistically significant difference between the two populations. In any other case, there is no statistically significant difference between the two populations. The test fails to reject the null hypothesis.
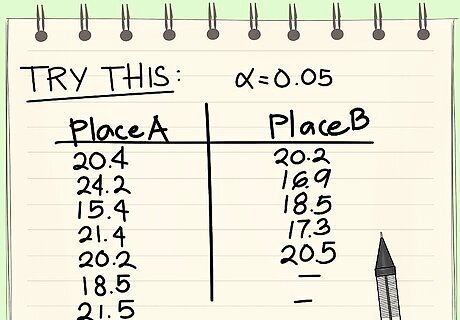
Use the following example problem to practice the equations given above.


Comments
0 comment