

Calculating SSE by Hand

Create a three column table. The clearest way to calculate the sum of squared errors is begin with a three column table. Label the three columns as Value {\displaystyle {\text{Value}}} {\text{Value}}, Deviation {\displaystyle {\text{Deviation}}} {\text{Deviation}}, and Deviation 2 {\displaystyle {\text{Deviation}}^{2}} {\text{Deviation}}^{2}.
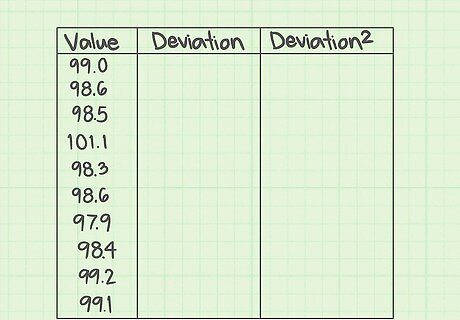
Fill in the data. The first column will hold the values of your measurements. Fill in the Value {\displaystyle {\text{Value}}} {\text{Value}} column with the values of your measurements. These may be the results of some experiment, a statistical study, or just data provided for a math problem. In this case, suppose you are working with some medical data and you have a list of the body temperatures of ten patients. The normal body temperature expected is 98.6 degrees. The temperatures of ten patients are measured and give the values 99.0, 98.6, 98.5, 101.1, 98.3, 98.6, 97.9, 98.4, 99.2, and 99.1. Write these values in the first column.
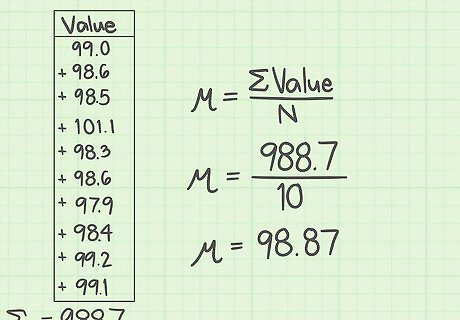
Calculate the mean. Before you can calculate the error for each measurement, you must calculate the mean of the full data set. Recall that the mean of any data set is the sum of the values, divided by the number of values in the set. This can be represented symbolically, with the variable μ {\displaystyle \mu } \mu representing the mean, as: μ = Σ x n {\displaystyle \mu ={\frac {\Sigma x}{n}}} \mu ={\frac {\Sigma x}{n}} For this data, the mean is calculated as: μ = 99.0 + 98.6 + 98.5 + 101.1 + 98.3 + 98.6 + 97.9 + 98.4 + 99.2 + 99.1 10 {\displaystyle \mu ={\frac {99.0+98.6+98.5+101.1+98.3+98.6+97.9+98.4+99.2+99.1}{10}}} \mu ={\frac {99.0+98.6+98.5+101.1+98.3+98.6+97.9+98.4+99.2+99.1}{10}} μ = 988.7 10 {\displaystyle \mu ={\frac {988.7}{10}}} \mu ={\frac {988.7}{10}} μ = 98.87 {\displaystyle \mu =98.87} \mu =98.87

Calculate the individual error measurements. In the second column of your table, you need to fill in the error measurements for each data value. The error is the difference between the measurement and the mean. For the given data set, subtract the mean, 98.87, from each measured value, and fill in the second column with the results. These ten calculations are as follows: 99.0 − 98.87 = 0.13 {\displaystyle 99.0-98.87=0.13} 99.0-98.87=0.13 98.6 − 98.87 = − 0.27 {\displaystyle 98.6-98.87=-0.27} 98.6-98.87=-0.27 98.5 − 98.87 = − 0.37 {\displaystyle 98.5-98.87=-0.37} 98.5-98.87=-0.37 101.1 − 98.87 = 2.23 {\displaystyle 101.1-98.87=2.23} 101.1-98.87=2.23 98.3 − 98.87 = − 0.57 {\displaystyle 98.3-98.87=-0.57} 98.3-98.87=-0.57 98.6 − 98.87 = − 0.27 {\displaystyle 98.6-98.87=-0.27} 98.6-98.87=-0.27 97.9 − 98.87 = − 0.97 {\displaystyle 97.9-98.87=-0.97} 97.9-98.87=-0.97 98.4 − 98.87 = − 0.47 {\displaystyle 98.4-98.87=-0.47} 98.4-98.87=-0.47 99.2 − 98.87 = 0.33 {\displaystyle 99.2-98.87=0.33} 99.2-98.87=0.33 99.1 − 98.87 = 0.23 {\displaystyle 99.1-98.87=0.23} 99.1-98.87=0.23
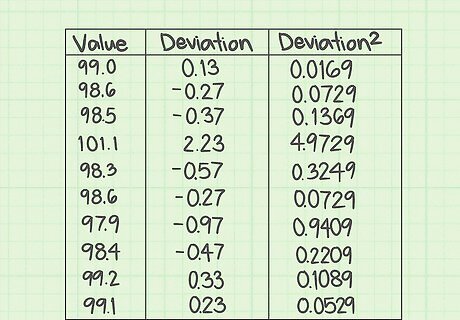
Calculate the squares of the errors. In the third column of the table, find the square of each of the resulting values in the middle column. These represent the squares of the deviation from the mean for each measured value of data. For each value in the middle column, use your calculator and find the square. Record the results in the third column, as follows: 0.13 2 = 0.0169 {\displaystyle 0.13^{2}=0.0169} 0.13^{2}=0.0169 ( − 0.27 ) 2 = 0.0729 {\displaystyle (-0.27)^{2}=0.0729} (-0.27)^{2}=0.0729 ( − 0.37 ) 2 = 0.1369 {\displaystyle (-0.37)^{2}=0.1369} (-0.37)^{2}=0.1369 2.23 2 = 4.9729 {\displaystyle 2.23^{2}=4.9729} 2.23^{2}=4.9729 ( − 0.57 ) 2 = 0.3249 {\displaystyle (-0.57)^{2}=0.3249} (-0.57)^{2}=0.3249 ( − 0.27 ) 2 = 0.0729 {\displaystyle (-0.27)^{2}=0.0729} (-0.27)^{2}=0.0729 ( − 0.97 ) 2 = 0.9409 {\displaystyle (-0.97)^{2}=0.9409} (-0.97)^{2}=0.9409 ( − 0.47 ) 2 = 0.2209 {\displaystyle (-0.47)^{2}=0.2209} (-0.47)^{2}=0.2209 0.33 2 = 0.1089 {\displaystyle 0.33^{2}=0.1089} 0.33^{2}=0.1089 0.23 2 = 0.0529 {\displaystyle 0.23^{2}=0.0529} 0.23^{2}=0.0529
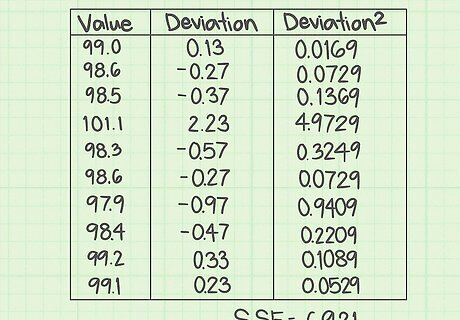
Add the squares of errors together. The final step is to find the sum of the values in the third column. The desired result is the SSE, or the sum of squared errors. For this data set, the SSE is calculated by adding together the ten values in the third column: S S E = 6.921 {\displaystyle SSE=6.921} SSE=6.921
Creating an Excel Spreadsheet to Calculate SSE

Label the columns of the spreadsheet. You will create a three column table in Excel, with the same three headings as above. In cell A1, type in the heading “Value.” In cell B1, enter the heading “Deviation." In cell C1, enter the heading “Deviation squared.”

Enter your data. In the first column, you need to type in the values of your measurements. If the set is small, you can simply type them in by hand. If you have a large data set, you may need to copy and paste the data into the column.

Find the mean of the data points. Excel has a function that will calculate the mean for you. In some vacant cell underneath your data table (it really doesn’t matter what cell you choose), enter the following: =Average(A2:___) Do not actually type a blank space. Fill in that blank with the cell name of your last data point. For example, if you have 100 points of data, you will use the function: =Average(A2:A101) This function includes data from A2 through A101 because the top row contains the headings of the columns. When you press Enter or when you click away to any other cell on the table, the mean of your data values will automatically fill the cell that you just programmed.

Enter the function for the error measurements. In the first empty cell in the “Deviation” column, you need to enter a function to calculate the difference between each data point and the mean. To do this, you need to use the cell name where the mean resides. Let’s assume for now that you used cell A104. The function for the error calculation, which you enter into cell B2, will be: =A2-$A$104. The dollar signs are necessary to make sure that you lock in cell A104 for each calculation.

Enter the function for the error squares. In the third column, you can direct Excel to calculate the square that you need. In cell C2, enter the function =B2^2
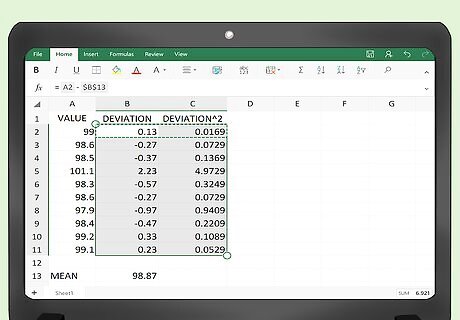
Copy the functions to fill the entire table. After you have entered the functions in the top cell of each column, B2 and C2 respectively, you need to fill in the full table. You could retype the function in every line of the table, but this would take far too long. Use your mouse, highlight cells B2 and C2 together, and without letting go of the mouse button, drag down to the bottom cell of each column. If we are assuming that you have 100 data points in your table, you will drag your mouse down to cells B101 and C101. When you then release the mouse button, the formulas will be copied into all the cells of the table. The table should be automatically populated with the calculated values.
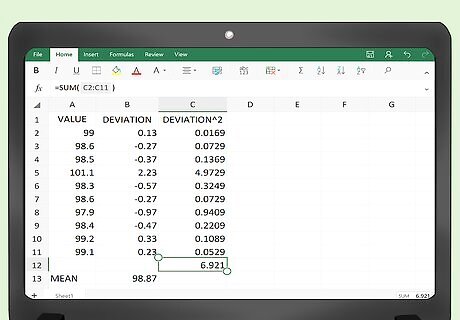
Find the SSE. Column C of your table contains all the square-error values. The final step is to have Excel calculate the sum of these values. In a cell below the table, probably C102 for this example, enter the function: =Sum(C2:C101) When you click Enter or click away into any other cell of the table, you should have the SSE value for your data.
Relating SSE to Other Statistical Data
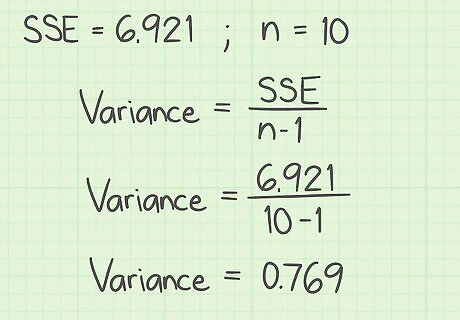
Calculate variance from SSE. Finding the SSE for a data set is generally a building block to finding other, more useful, values. The first of these is variance. The variance is a measurement that indicates how much the measured data varies from the mean. It is actually the average of the squared differences from the mean. Because the SSE is the sum of the squared errors, you can find the average (which is the variance), just by dividing by the number of values. However, if you are calculating the variance of a sample set, rather than a full population, you will divide by (n-1) instead of n. Thus: Variance = SSE/n, if you are calculating the variance of a full population. Variance = SSE/(n-1), if you are calculating the variance of a sample set of data. For the sample problem of the patients’ temperatures, we can assume that 10 patients represent only a sample set. Therefore, the variance would be calculated as: Variance = SSE ( n − 1 ) {\displaystyle {\text{Variance}}={\frac {\text{SSE}}{(n-1)}}} {\text{Variance}}={\frac {{\text{SSE}}}{(n-1)}} Variance = 6.921 9 {\displaystyle {\text{Variance}}={\frac {6.921}{9}}} {\text{Variance}}={\frac {6.921}{9}} Variance = 0.769 {\displaystyle {\text{Variance}}=0.769} {\text{Variance}}=0.769

Calculate standard deviation from SSE. The standard deviation is a commonly used value that indicates how much the values of any data set deviate from the mean. The standard deviation is the square root of the variance. Recall that the variance is the average of the square error measurements. Therefore, after you calculate the SSE, you can find the standard deviation as follows: Standard Deviation = SSE n − 1 {\displaystyle {\text{Standard Deviation}}={\sqrt {\frac {\text{SSE}}{n-1}}}} {\text{Standard Deviation}}={\sqrt {{\frac {{\text{SSE}}}{n-1}}}} For the data sample of the temperature measurements, you can find the standard deviation as follows: Standard Deviation = SSE n − 1 {\displaystyle {\text{Standard Deviation}}={\sqrt {\frac {\text{SSE}}{n-1}}}} {\text{Standard Deviation}}={\sqrt {{\frac {{\text{SSE}}}{n-1}}}} Standard Deviation = 6.921 9 {\displaystyle {\text{Standard Deviation}}={\sqrt {\frac {\text{6.921}}{9}}}} {\text{Standard Deviation}}={\sqrt {{\frac {{\text{6.921}}}{9}}}} Standard Deviation = .769 {\displaystyle {\text{Standard Deviation}}={\sqrt {.769}}} {\text{Standard Deviation}}={\sqrt {.769}} Standard Deviation = 0.877 {\displaystyle {\text{Standard Deviation}}=0.877} {\text{Standard Deviation}}=0.877

Use SSE to measure covariance. This article has focused on data sets that measure only a single value at a time. However, in many studies, you may be comparing two separate values. You would want to know how those two values relate to each other, not only to the mean of the data set. This value is the covariance. The calculations for covariance are too involved to detail here, other than to note that you will use the SSE for each data type and then compare them. For a more detailed description of covariance and the calculations involved, see Calculate Covariance. As an example of the use of covariance, you might want to compare the ages of the patients in a medical study to the effectiveness of a drug in lowering fever temperatures. Then you would have one data set of ages and a second data set of temperatures. You would find the SSE for each data set, and then from there find the variance, standard deviations and covariance.


Comments
0 comment